
Scaling BI with Microsoft Fabric Lakehouse in a Pharma Portfolio

A nationwide product launch dashboard gave a leading pharmaceutical company one reliable view of execution during a high-stakes launch window. Once the launch wrapped, the organization wanted more: a single view across every brand and product it managed, long-established or brand-new.
Kitameraki returned to widen it: the dashboard needed to cover every product in the portfolio, well beyond the one launch it started with. Two measures had to hold steady across all of them: how customer engagement was performing, and how much revenue those efforts generated across field teams. That meant rebuilding the data layer underneath the dashboard too, replacing Power Query and a standalone semantic model with Microsoft Fabric Lakehouse as the backbone.
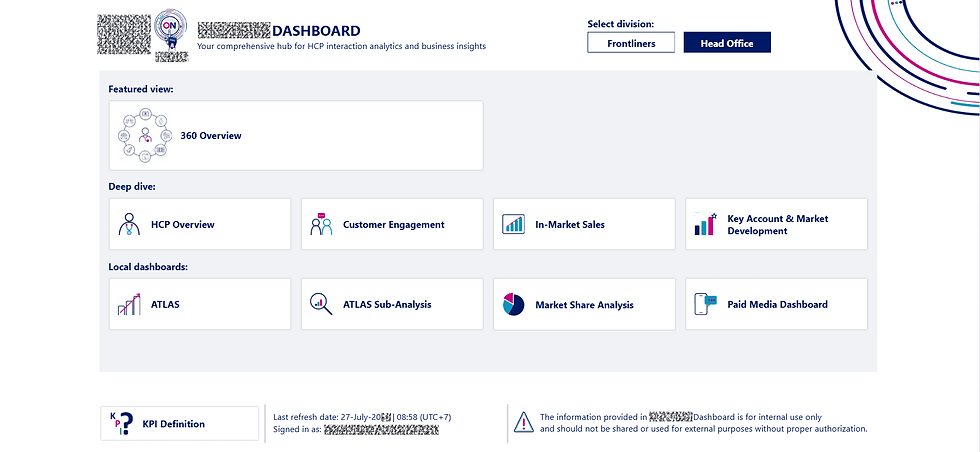
From a Single Launch to a 360 View Across the Portfolio
The original dashboard tracked one launch and the months around it. Other products in the portfolio had already been on the market for years, each monitored on its own with no shared view connecting them. As that dashboard proved its value, the organization set its sights on one view covering every product's operations.
The wider view raised a different problem than the original dashboard had. The platform now had to pull together performance data from products deep into their lifecycle and others still pre-launch, then let leadership compare them side by side, any week of the year.
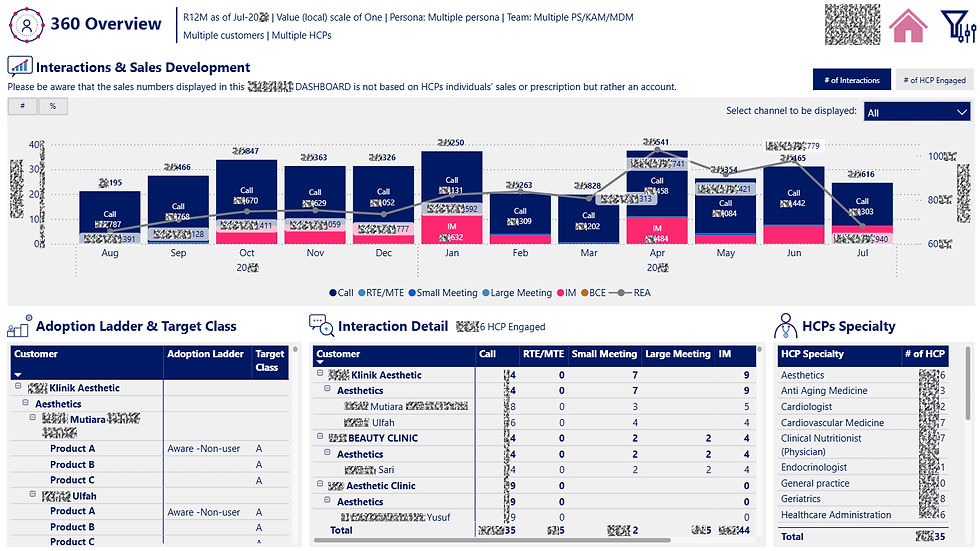
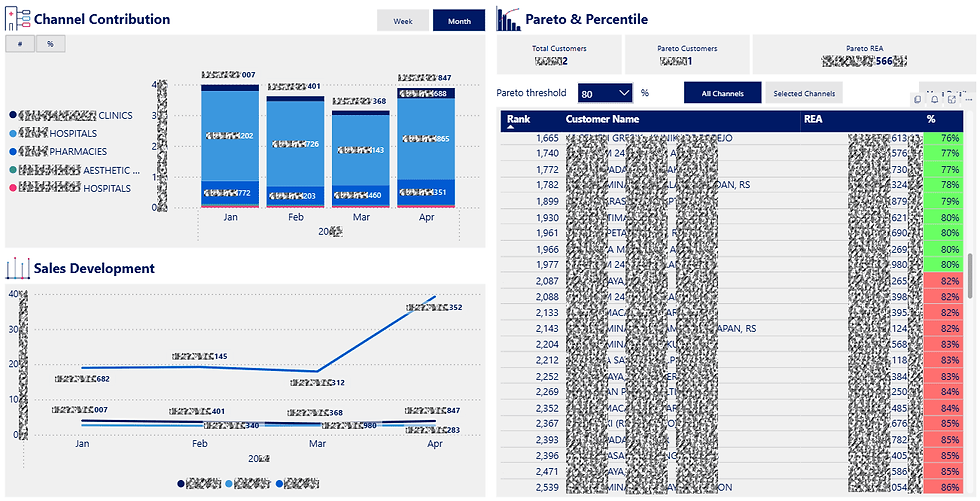
Expanding the KPI Framework
With the scope wider, Kitameraki and the organization agreed on two measurement areas to apply the same way across every product:
Customer engagement effort: reach, frequency, and quality of engagement with healthcare professionals and other customer segments across campaigns
Sales results from field teams: call activity, conversion from engagement to sales, and performance by territory and team
Once settled, those definitions didn't need renegotiating for every new product launch. The portfolio could grow without the comparison breaking down.
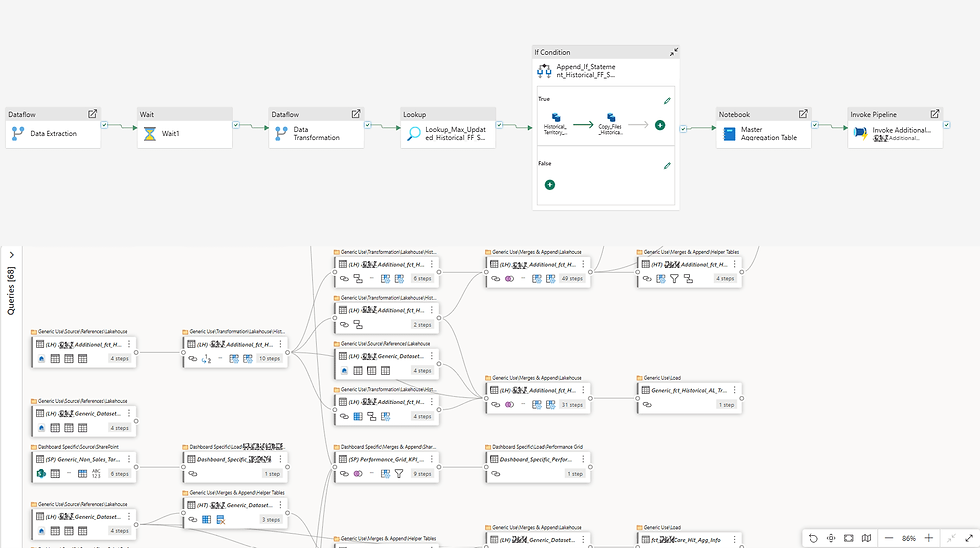
Rebuilding the Data Backbone on Microsoft Fabric Lakehouse
The original dashboard ran on Power Query for data preparation and a Power BI semantic model for reporting, a setup suited to a single, well-defined launch. Extending that same approach across the full portfolio would have meant repeating the same manual preparation work for every product, with the risk of growing inconsistency between them.
To support the platform going forward, the underlying infrastructure was rebuilt on Microsoft Fabric Lakehouse. Data from each client product's systems and campaigns now lands in a single, centralized Lakehouse built on OneLake, rather than being prepared separately product by product. From there, it moves through structured processing layers before reaching the semantic model that feeds the dashboard, giving the organization one governed data source instead of many parallel ones.
This shift also gave the platform room to grow. Adding a new product to the dashboard now means extending an existing data pipeline rather than rebuilding one, and processing scales with the size of the portfolio rather than the complexity of a single launch.
How the Enhanced Dashboard is Used
Marketing and field force teams now use the dashboard as a standing, 360 reference point for critical operations rather than a tool tied to a launch window, whether the product in view launched years ago or is still ahead of it.
Review how engagement efforts are performing for each product, by channel and campaign
Track sales results across field teams and compare performance by territory
Compare engagement and sales performance across the full portfolio
Flag products or teams that need attention without waiting for a launch review or a scheduled report cycle
For leadership, this turned what used to be a one-time launch tool into a standing, 360-view of commercial performance across the business.
What This Architecture Makes Possible
Rebuilding the dashboard around a 360, portfolio-wide view and a centralized Lakehouse backbone changed how the organization works with its performance data:
A single platform covering customer engagement and sales performance for every client product, regardless of launch stage
One centralized, governed data source in place of separate preparation works per product
Faster, more consistent processing as products is added to the platform, whether newly launched or already established
Clearer comparison of marketing effort and sales results across teams and territories
A reusable foundation the organization can extend as its product portfolio continues to grow
As a result, reviewing performance across the portfolio no longer depends on a launch calendar or on consolidating separate reports for each product, freeing teams to spend more time acting on what the data shows.
Conclusion
This project shows how far a dashboard built for one launch can reach when the data underneath it is built to scale. Kitameraki carried forward what worked in the original build and moved the data layer onto Microsoft Fabric Lakehouse, so the platform can grow alongside the portfolio without a rebuild each time. As it runs through its first full reporting cycles, that same architecture is what will let leadership track results across the whole portfolio, not just one launch at a time.
Ready to scale a single dashboard across your whole business? Our data and analytics team can help map out what a Fabric Lakehouse-based platform could look like for your data.
Kitameraki is a trusted partner for comprehensive IT consulting and IT services in Indonesia. With a strong focus on IT solutions, web development, mobile app development, and cloud solutions, we help businesses navigate the ever-evolving digital landscape. Our expertise extends to cloud services, cloud migration, data analytics, big data, business intelligence, data science, and cybersecurity.


Comments